Reaching level 9 in ranked TFT meant a top‑4 finish 87% of the time.
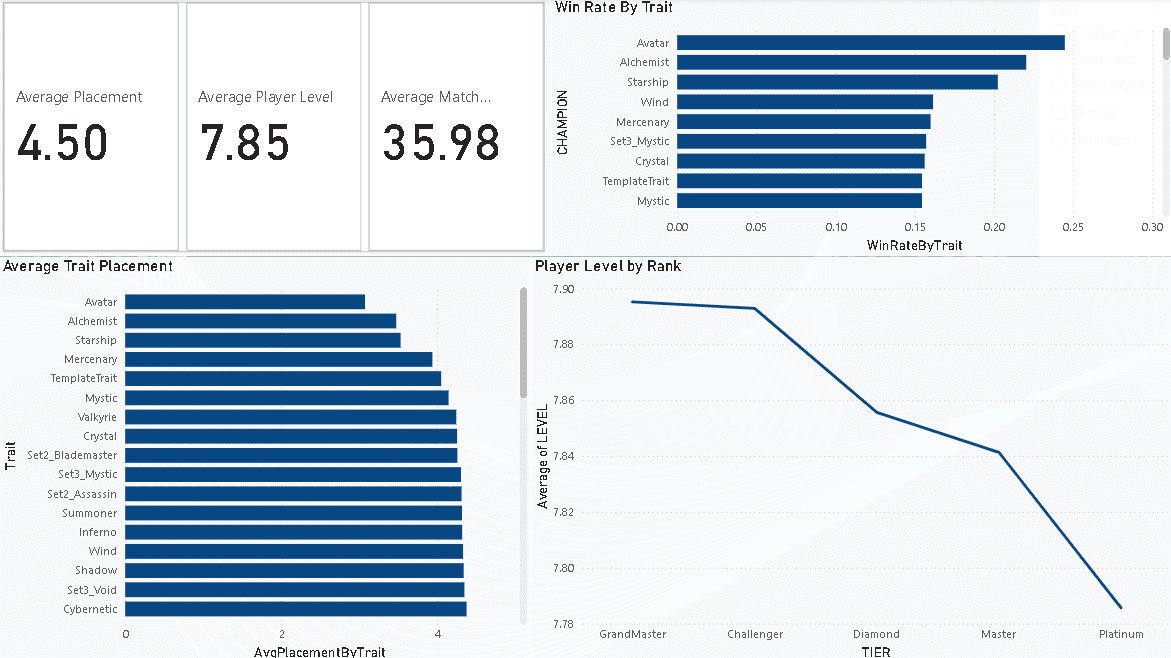
Loaded ~400K ranked Teamfight Tactics player boards (49,977 matches, Platinum to Challenger) into Snowflake, unpacked nested trait data with SQL, and built a Power BI dashboard on what separates top‑4 finishes.
- Project
- TFT Ranked Match Analysis in Snowflake
- Role
- Data Analyst (Solo Project)
- When
- Fall 2025
- Matches
- 49,977
- Player Boards
- 399,906
What I found
- Reaching level 9 was the strongest signal found: 86.6% top‑4 rate vs 51.3% at level 8.
- Starship (69.0% top‑4) and Mercenary (60.6%) boards placed best; Vanguard (48.1%) and Sorcerer (49.2%) placed worst among common traits.
- Flagged that trait results are confounded with level: high-cost traits mostly appear on boards that were already ahead.
The data
Set 3 ranked matches, Korean server, Platinum to Challenger.
Source: 399,906 player boards from 49,977 Set 3 ranked matches (Korean server, Platinum to Challenger), cleaned and queried in Snowflake. Players who are already ahead level faster, so this is an association, not a cause.
| Name | Top-4 rate |
|---|---|
| Starship23.2K boards, avg 3.53 | 69.0% |
| Mercenary127.3K boards, avg 3.94 | 60.6% |
| Valkyrie178.6K boards, avg 4.24 | 54.9% |
| Mystic140.9K boards, avg 4.30 | 53.4% |
| Sorcerer136.0K boards, avg 4.54 | 49.2% |
| Vanguard191.0K boards, avg 4.59 | 48.1% |
| Half of all boards finish top four. Traits with 5,000+ boards. | |
These are correlations, not trait strength. Starship is a single 5-cost unit, so it mostly shows up on boards that already reached a high level, and level separates outcomes more than any single trait.
- 1
5 ranked CSVs
Platinum, Diamond, Master, Grandmaster and Challenger, about 80K player boards each.
- 2
Internal stage and file format
Files uploaded to a Snowflake stage; the CSV format handles quoted fields, headers and null strings.
- 3
COPY INTO matches
One load per rank tier, tagging each row with its tier and parsing the nested trait and champion text into VARIANT.
- 4
Analysis queries
LATERAL FLATTEN unpacks the trait VARIANT so placement can be aggregated per trait and per player level.
- 5
Power BI dashboard
Live Snowflake connection: KPIs, placement by rank tier, and trait effectiveness.
The question
Ranked TFT match exports store each board's traits and champions as nested text, one CSV per rank tier. That makes it hard to answer basic questions like which traits and levels actually lead to top‑4 finishes.
How I built it
- Staged 5 rank-tier CSVs (Set 3, Korean server) in Snowflake with a custom CSV file format.
- Loaded each tier with COPY INTO, tagging rows by rank and parsing nested trait/champion text into VARIANT columns.
- Removed duplicate rows and rows with invalid placements before analysis.
- Used LATERAL FLATTEN to unpack traits and aggregate placement and top‑4 rate per trait and per player level.
- Connected Power BI directly to Snowflake for KPI, rank-tier and trait-effectiveness views.
The code
SQL (Snowflake)
-- Top-4 rate and average placement per trait
SELECT
  REPLACE(t.key, 'Set3_', '')                         AS trait,
  COUNT(*)                                            AS boards,
  ROUND(AVG(m.placement), 2)                          AS avg_placement,
  ROUND(AVG(IFF(m.placement <= 4, 1, 0)) * 100, 1)    AS top_4_rate_pct
FROM matches m,
     LATERAL FLATTEN(input => m.traits) t
WHERE m.placement BETWEEN 1 AND 8
GROUP BY 1
HAVING COUNT(*) >= 5000
ORDER BY avg_placement;
What I delivered
A reproducible Snowflake load (scripts run in order) feeding a Power BI dashboard on placement, rank tier and trait effectiveness.