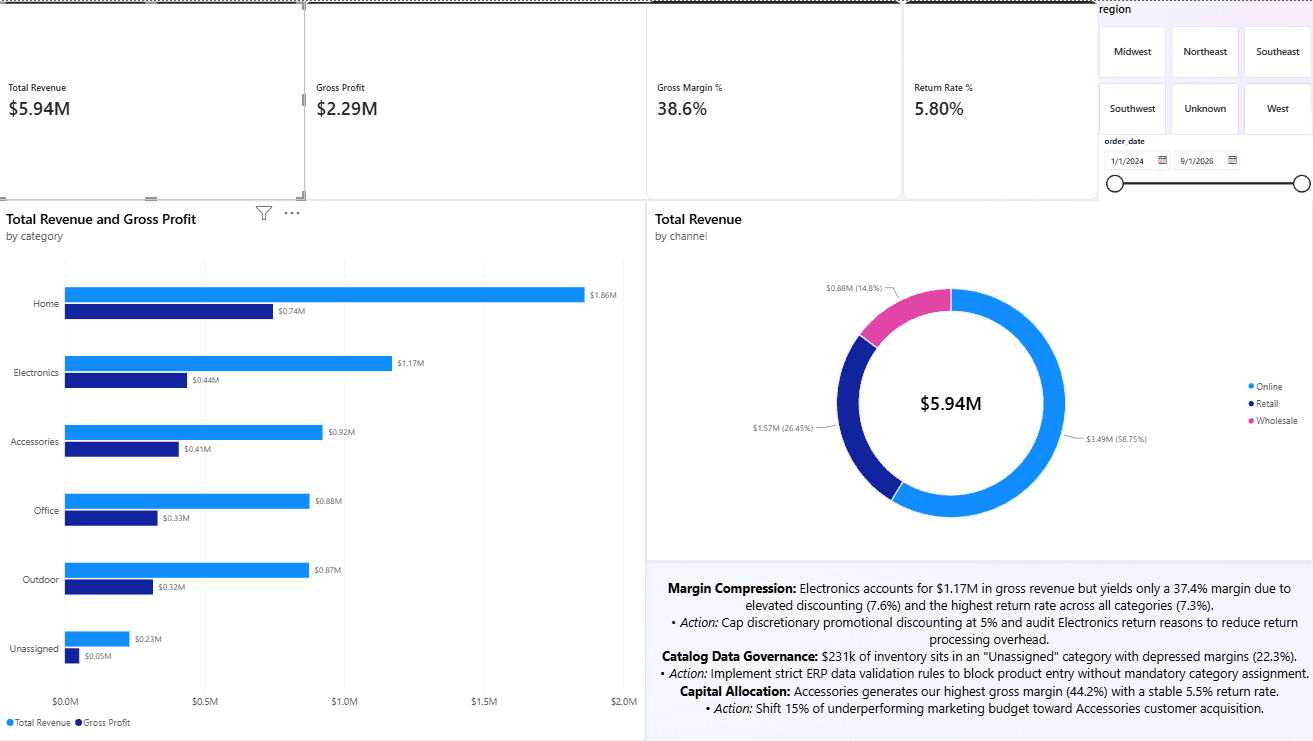
Electronics was losing margin to discounts and returns.
Engineered an end-to-end PostgreSQL data analytics pipeline and interactive Power BI Executive Command Center to diagnose margin decay ($5.94M revenue, $2.29M profit) across 63k+ order transactions.
- Project
- Northstar Commerce Executive BI Dashboard & Data Pipeline
- Role
- Lead BI & Data Analyst
- When
- 1 Month
- Net Revenue
- $5.94M
- Gross Profit Margin
- 38.6%
What I found
- Uncovered Electronics margin compression driven by 7.62% average discounting and 7.26% return rate.
- Identified $231k drag from Unassigned inventory categories performing at 22.28% margin vs 38.57% baseline.
- Highlighted Accessories as the highest margin expansion opportunity at 44.21% gross margin.
The data
Northstar Commerce order, product, customer and return tables.
| Name | Gross margin |
|---|---|
| Accessories | 44.2% |
| Company overall | 38.6% |
| Unassigned | 22.3% |
| Company gross margin, 38.57% | |
Source: 63,635 order items, $5.94M net revenue, $2.29M gross profit, modeled in PostgreSQL.
Electronics: high revenue, eroded by discounts and returns
Electronics brings in $1.17M of revenue but carries a 7.62% average discount and a 7.26% return rate.
Recommendation: Cap discretionary promotional discounts at 5% and audit suppliers of the most-returned SKUs.
$231k drag from products with no category
Products left as Unassigned earn a 22.28% gross margin, against a 38.57% company baseline.
Recommendation: Block item creation without a category so new products are classified and priced correctly.
Accessories has the best margin in the catalog
Accessories earns a 44.21% gross margin with a 5.55% return rate.
Recommendation: Shift acquisition spend toward Accessories.
| From | To | Key |
|---|---|---|
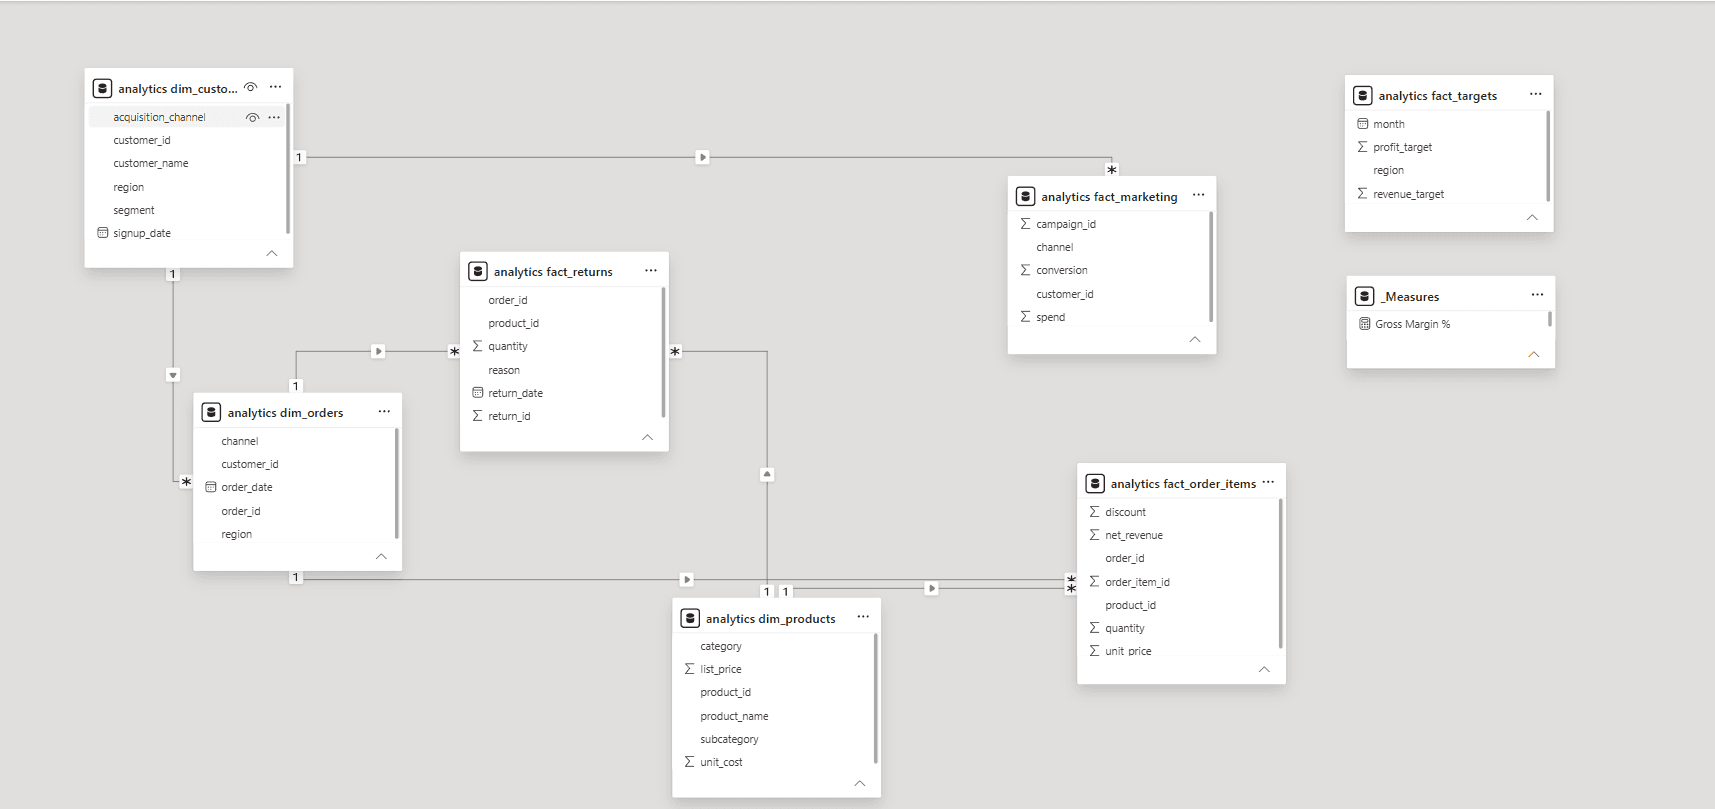
| fact_order_items | dim_orders | order_idmany to one |
| fact_order_items | dim_products | product_idmany to one |
| dim_orders | dim_customers | customer_idmany to one |
| fact_returns | dim_orders, dim_products | order_id, product_idcomposite key |
The question
Northstar Commerce scaled to $5.94M in net revenue across 63,635 order items, but leadership lacked visibility into profit margin compression in top categories, data quality anomalies (duplicates, missing categories), and high return rates.
How I built it
- Loaded 7 raw staging tables into PostgreSQL database and executed comprehensive SQL data quality diagnostics.
- Engineered an automated SQL ETL pipeline (ROW_NUMBER window function deduplication, COALESCE missing metadata imputations, CASE channel standardization).
- Designed a production Star Schema relational model connecting Fact tables (order_items, returns, targets) to Dimension tables (customers, products, orders).
- Created production analytical views (vw_order_details, vw_monthly_performance) and built interactive DAX measures in Power BI Desktop.
The code
SQL (PostgreSQL)
-- Executive Sales & Profit Margin View (PostgreSQL)
CREATE VIEW analytics.vw_order_details AS
SELECT
    oi.order_item_id,
    o.order_id,
    o.order_date,
    c.customer_id,
    c.customer_name,
    c.segment AS customer_segment,
    COALESCE(c.region, 'Unknown') AS customer_region,
    o.channel AS sales_channel,
    p.product_id,
    p.product_name,
    p.category AS product_category,
    oi.quantity,
    oi.net_revenue,
    ROUND((oi.quantity * p.unit_cost), 2) AS total_cost,
    ROUND(oi.net_revenue - (oi.quantity * p.unit_cost), 2) AS gross_profit,
    ROUND(((oi.net_revenue - (oi.quantity * p.unit_cost)) / oi.net_revenue) * 100, 2) AS gross_margin_pct
FROM analytics.fact_order_items oi
JOIN analytics.dim_orders o ON oi.order_id = o.order_id
JOIN analytics.dim_customers c ON o.customer_id = c.customer_id
JOIN analytics.dim_products p ON oi.product_id = p.product_id;
What I delivered
Constructed an executive-facing Power BI Command Center highlighting category profit margins, monthly target vs. actual variance, return rate leakage, and strategic pricing action items.